Wer sich erfolgreich an den Finanzmärkten behaupten will und gegenüber seinen Konkurrenten einen Informationsvorsprung haben möchte, der sollte auf solide Statistiken zurückgreifen können. Am besten mit einem emotionslosen DayTrading Expert Advisor traden.
The most rudimentary and most easily understandable form of a seasonal chart is the temperature curve of a year in Central Europe, for example in Germany. Every child already knows that it tends to be warmer in the summer months in this country and gets colder and colder as winter approaches. A statistical regularity that repeats itself year after year. But how can we use all of this for trading?
Mithilfe von saisonalen Chartmustern profitabel traden
There are also recurring trend patterns on the financial markets that can be repeated and evaluated year after year. The existence of these seasonal patterns is not necessarily due to the temperature, although this naturally has an impact on the seasonality of agricultural commodities such as wheat, orange juice or corn. For example, companies have to stock up on heating oil or petrol in good time before the winter begins. In addition to the current production volumes, the harshness of the winter also has an impact on the seasonality of the oil price in the following year.
However, seasonalities are not only seasonal, tax law aspects also have an impact on the development of currencies. In addition, seasonalities from some asset classes have a regular, measurable influence on the course of other asset classes, which results in a correlation between these values that can be observed, evaluated and traded.
In many cases, the reason for the seasonality is not even known. Does he have to interest us at all? Not necessarily. When you spot an annual chart pattern, as long as it works, you can take advantage of it. Even individual stocks often show surprisingly strong seasonality, which is related to stronger and weaker sales months.
Seasonales DAX Daytrading Chartmuster
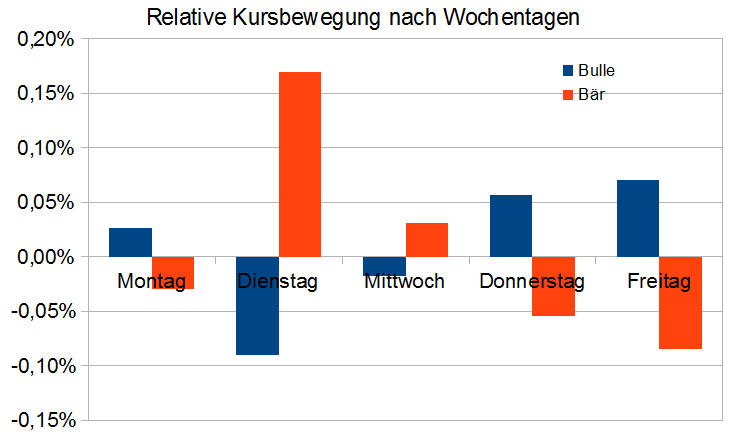
Gibt es typische seasonale Dax Muster für die Tagesänderung des (F)DAX in Abhängigkeit davon, ob wir in einem Bären- oder Bullenmarkt sind? Als Tagesänderung soll nun die prozentuale Änderung zwischen Börseneröffnung um 8 Uhr und Börsenschluss um 22 Uhr betrachtet werden. Das Ergebnis ist verblüffend:

Jetzt erkennen wir sofort einen markanten und eindeutigen Zusammenhang. In einem Bullenmarkt steigen die DAX-Kurse am Montag, Donnerstag und Freitag, während die Kurse am Dienstag und Mittwoch eher fallen. In einem Bärenmarkt ist es exakt andersherum. So if you are looking for a buy signal in a bull market, you should get in at the end of the week and definitely avoid Tuesday. The question of "why" is of course exciting, but for us it is pure speculation. You could definitely write great stories here, but more interesting is: can this probability advantage now also be converted directly into a profit advantage?
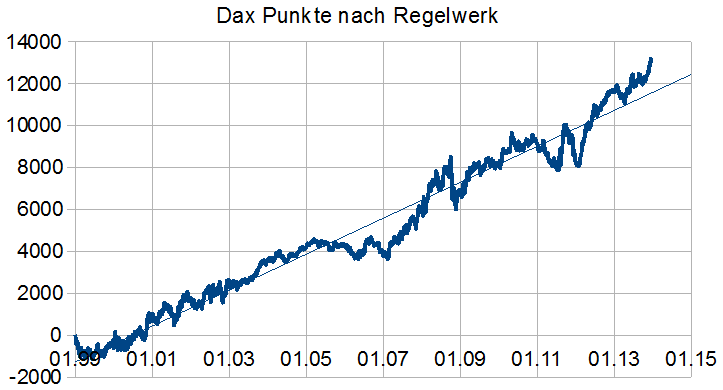
Here we can now make a simple calculation according to fixed rules and then carry out a profit calculation with the historical data. If the opening price on a day is above the EMA80 of the previous day (=> bull market) and it is e.g. Monday, a long position is opened and closed at the end of the day. On a Tuesday, you would buy a short position to open (in a bull market) and also sell again at the end of the day. Applying this simple rule to the historical data yields the following summary of FDAX points.

In total, almost 14,000 FDAX points would have been collected in 14 years. So, a probability advantage became a real profit advantage. In a closer look, one would now consider the real spread (difference between buying and selling price) and certainly also define a stop loss for the individual trades. However, the basic system is impressively simple and still offers numerous optimization options.
Seasonal DAX DayTrading Expert Advisor
Und zum Schluss das Beste => Wir haben diese Strategie in einem DayTrading Expert Advisor umgesetzt. Zum Seasonal DAX Expert Advisor
Have fun trading!
Bild und Quelle: godmode-trader.de & devisen-handeln.org
